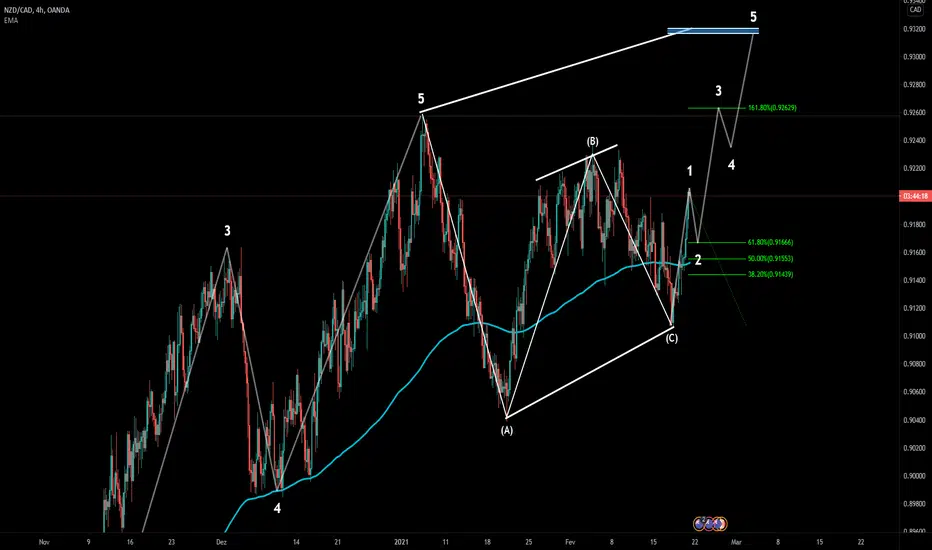
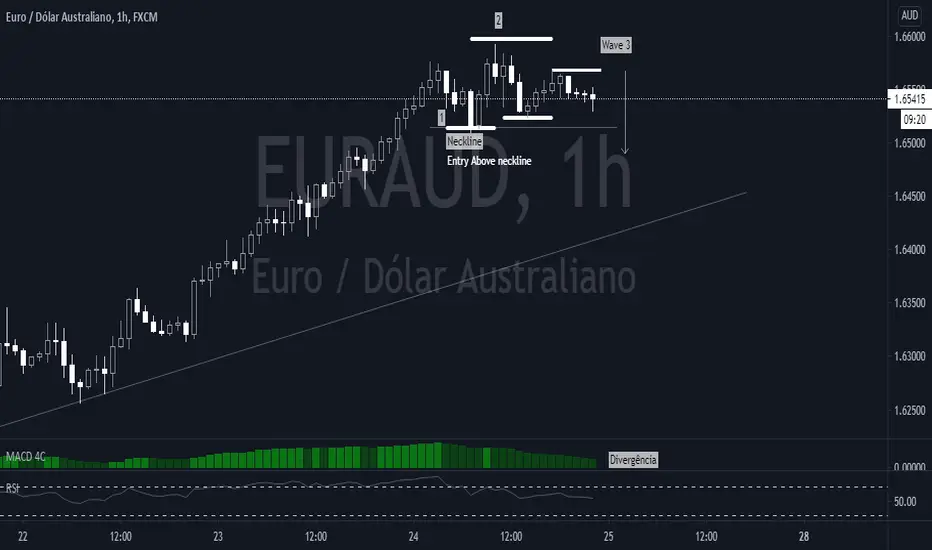
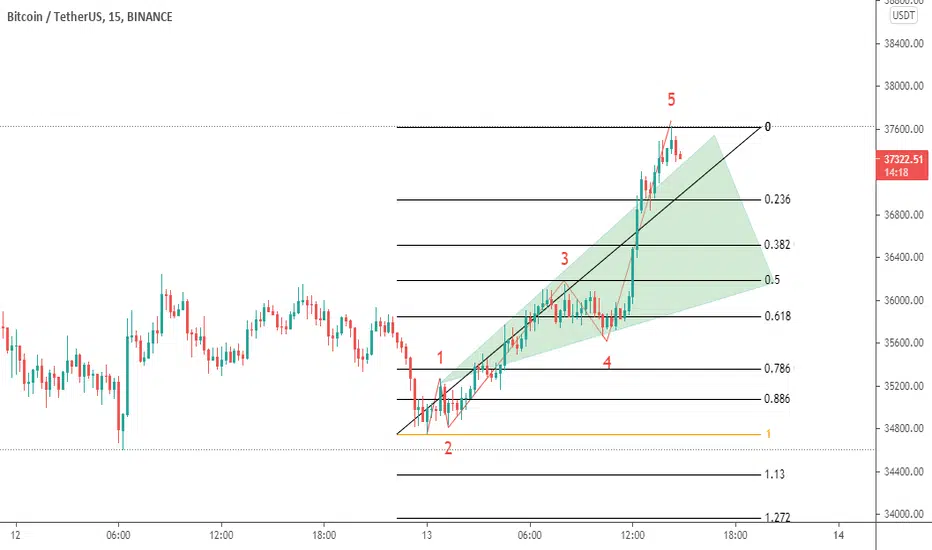
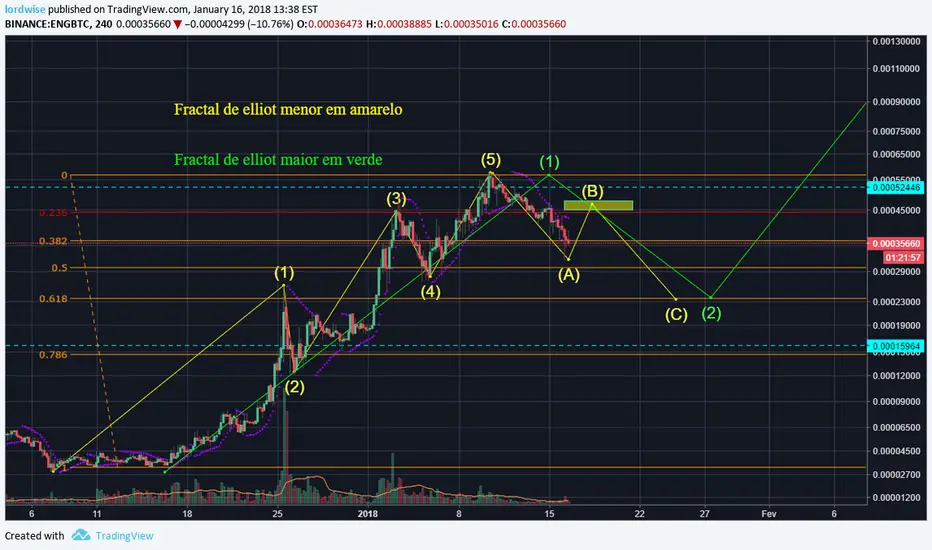
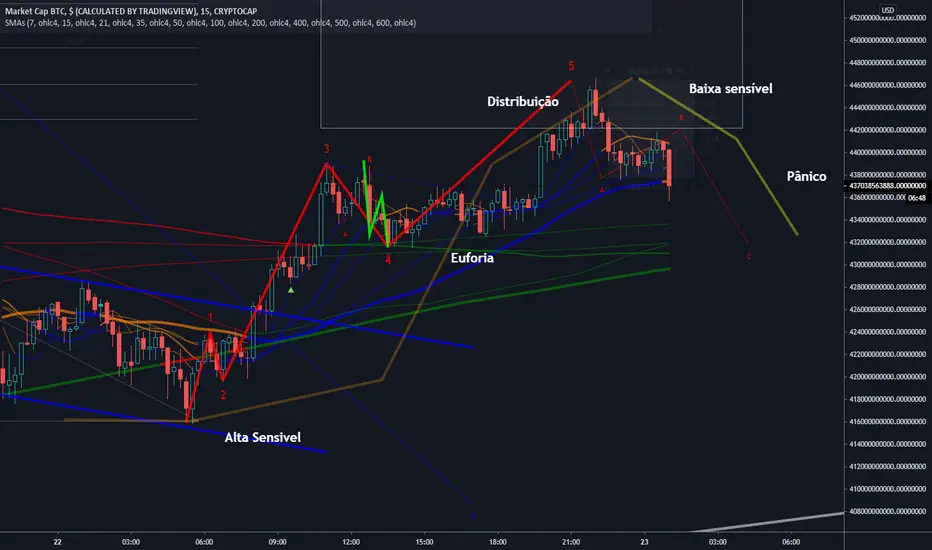
Viés de baixa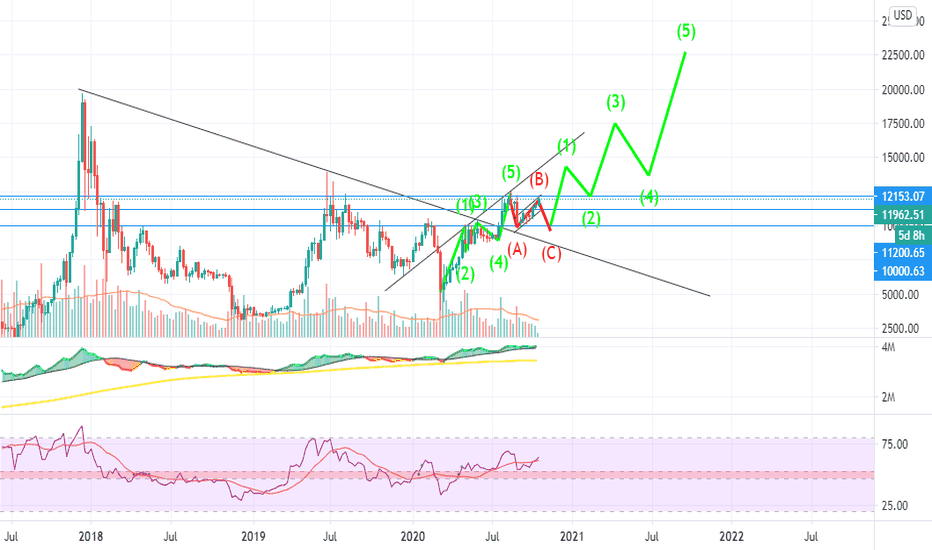
Viés de baixa 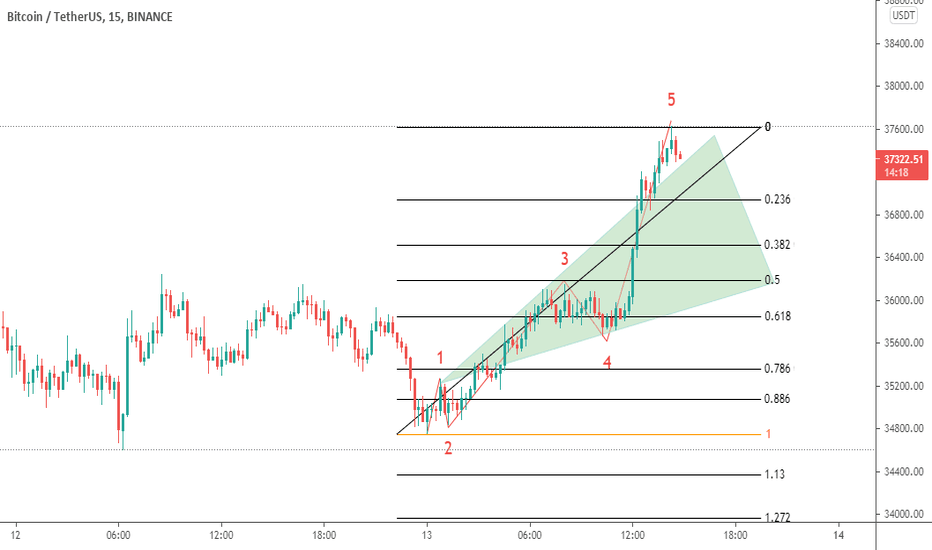
Viés de baixa 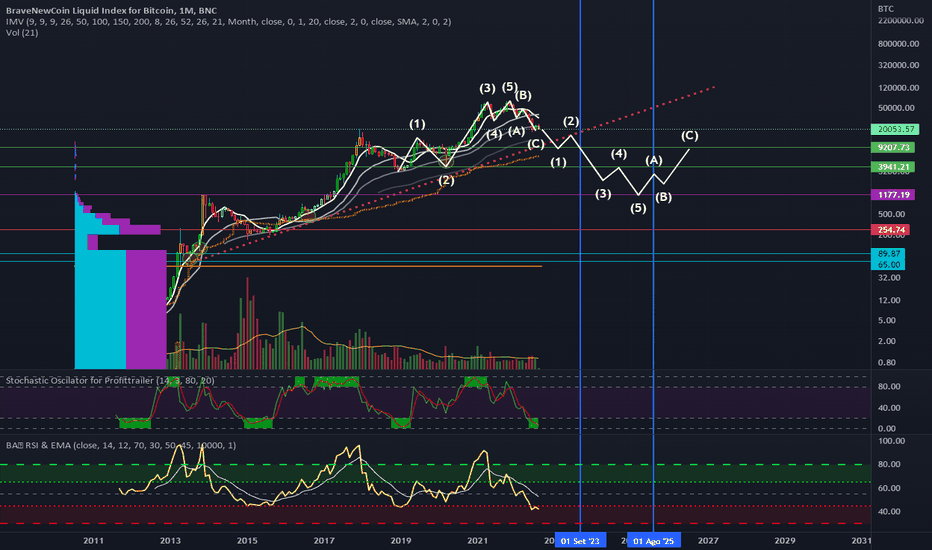
Sp 500 Technical analysis based on Elliot waves
This is what I am putting my money into, yet, I do not recommend anyone to follow anyone's advice blindly. Please Like this post for reputation :)
On a logarithm scale of the weekly Sp 500 chart we can see clear as day the formation of a reverse symetrical triangle. According to Elliot`s theory, this kind of formation is usually seen at the end of a larger trend, meaning that even thought on the medium- short term would see a fall all the way to 2000, followed by a rise at the end of the formation, reaching new highs on the long term. On the first part of this post I will explain what is this pattern, on the second part the arguments in favor of this theory, wich have hold thus far, and on the third part, I will explain what to watch for in case I am wrong, the events that would debunk this pattern. Let's get into it.
Part one: What is a reverse Symetrical triangle?
In his book, The Wave Principal, RN Elliot said that reverse symetrical triangles are the rarest kind of triangles and are a form of correction usually appearing at the end of a one degree higher formation being wave four of an impulse, wave B of ABC or the final wave X in a double or triple zig-zag or combination. They only appear in one variation: 3-3-3-3-3, meaning that waves ABCDE can all be subdivided into 3 waves.
Part two: Arguments in favor-
1- Subwaves count : ABCDE waves can be subdivided into 3 subwaves: impulsive, corrective and impulsive.
2- Volume : Since it's a corrective wave of a larger bull trend, the main direction of this triangle is down. Therefore we shoud expect waves ACE to point down and have a higher volume than BD and an expressive increase of volume from A to C and C to E (Elliot stated that even thought volume is not a rule of markets, it can appear, giving strenght to the analysis). On the chart we can see that wave A had a spike on feb 18 2018, and wave B a very small volume. Once we enter wave C there is an huge spike of volume when compared to both B and A. Wave D, again, shows decreased volume even though the prices go up by 40% during that period. Finally we enter wave E, the recent 36% drop followed by 26% recover in 56 days. The biggest volume spike world has ever seen.
3- Time Periods : While Impulsive (ACE in a triangle) waves have the charachteristic of dramatic price changes in relatively small periods of time, corrections waves (BD in a triangle) are slow and drag for really long periods. On the chart wave A drops roughly 10 % in 50 days. Wave B goes up by 15% in 195 days. Wave C drops 18% in 90 days. Wave B goes up by 40% in 420 days and finally wave E drops 36% in 30 days, only to continue on a 26% rally up on the following two weeks.
Since this is a simultaneous analysis, as I`m writing this we are still in wave E I can only estimate how far down it will go once the current rally up finishes. It is also important to say that this rally is to be expected in this fomation, since it has only so far corrected the initial 36% movement.
Part three: what to watch for?
If the prices go past the 2870 resistence (green line in chart) and continue to go up or stay there for a long period of time ~3-6 (months), this would mean that either there was never this formation, my analysis is ultimately wrong and we are indeed seing the begining of a bull market or federeral interference is manipulating the market prices.
If the prices cannot go past 2870 and the market starts again to fall, it would be expected to go all the way to the 2000 resistence in another really fast drop.
I would also like to point for education purposes mainly, since it starts with too many if`s, that it is common for E waves to do what elliot called a throw over, go past the point it is expeted to go, only to rally back on the opposite direction. On our current example, If we were to see another large drop, and if it completed the pattern going all the way to 2000, the panic can cause a throw over, making the prices go even lower, only to be followed by a new strong bull market.
Extra: The light at the end of the Tunnel
On my personal analysis I believe that once we hit the 2000 point, we will see the next bull market, and it will take the sp 500 to new highs. Let's see how the following years go. Best of luck on trades!
Caio
 Viés de baixa
XAUUSD Bearish CenarioFOREXCOM:XAUUSD
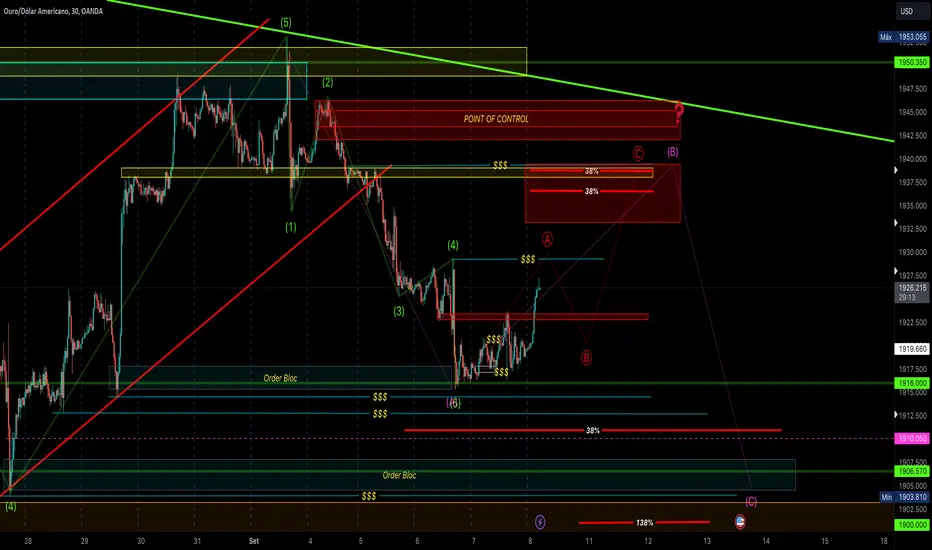
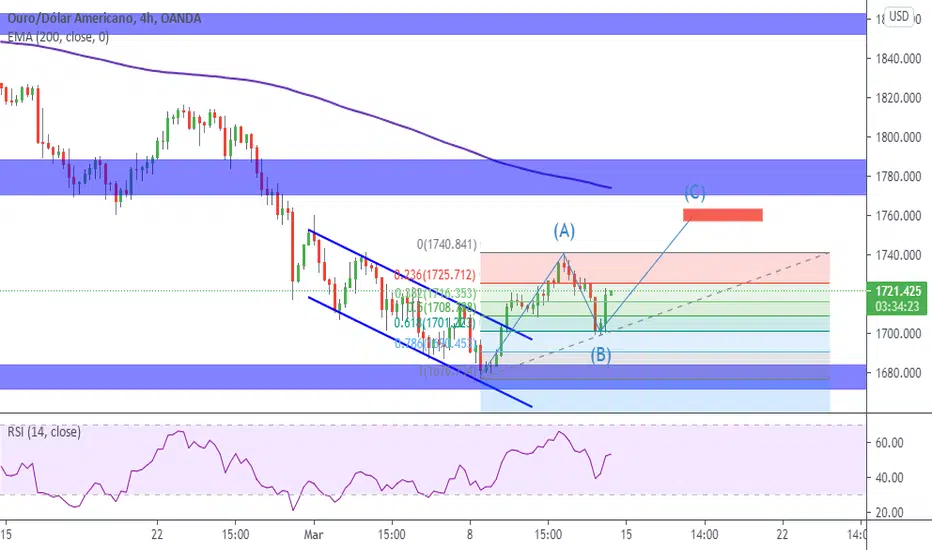
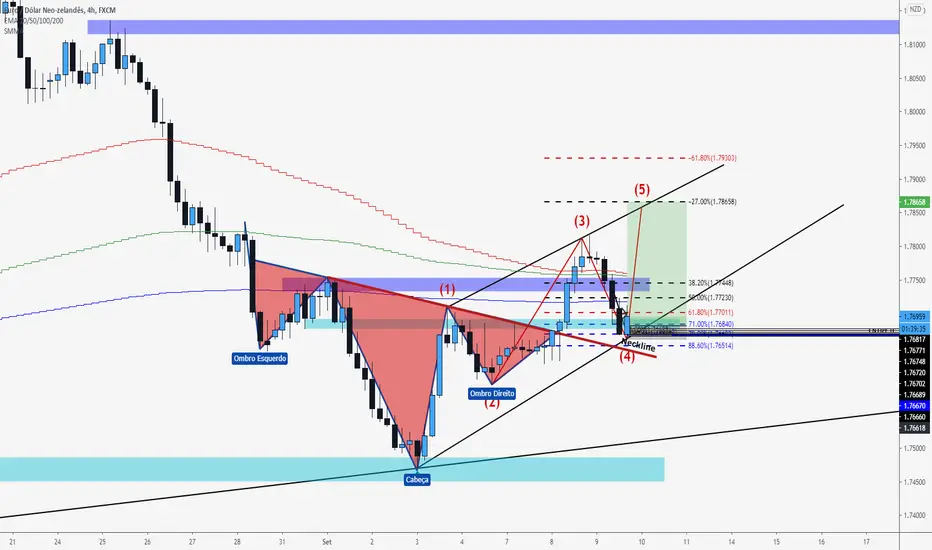
PT- Podemos ver um padrão de triângulo em grande imagem e um padrão de reversão de Cabeça e Ombro, que nos dá a tendência de baixa, que levou a liquidez vendedora e fez um novo baixo, então agora terminamos um grande reteste para a linha do pescoço do padrão H&S, neste caso, podemos usar a onda impulsiva Elliot 12345 que terminou na zona fresca de supply na resistência e Neckline do padrão H&S, antes da queda do preço, tomou a liquidez compradora e em seguida, uma grande queda impulsiva, neste caso, esta será uma onda corretiva Elliot ABC. Então, agora o preço caiu para o bloco de ordem de alta, se o preço respeitar o OB, podemos ver um movimento corretivo na onda menor ABC que será a onda B da onda Elliot intermediária. Temos uma grande probabilidade de que o preço tome a liquidez vendedora antes de subir para a zona de resistência para terminar a onda B. Na zona de resistência temos pequenos máximos iguais que têm liquidez para tomar e se usarmos fibonacci invertido, podemos ver 38% (zona dourada) para que possamos esperar algum padrão de reversão entre 38 e 50% de fibonacci invertido. Quando o preço atinge o nosso olho vermelho, podemos procurar oportunidades de venda e quando o preço atinge o nosso olho verde, podemos procurar oportunidades de compra. Não se apressem, existem muitas oportunidades no mercado, definam alertas de preços e mantenham a calma, esperem pela vossa oportunidade de entrar e não se esqueçam de seguir um plano de gestão de risco que seja adequado ao vosso capital. Que DEUS vos abençoe e tenham uma boa negociação. Se puderem partilhar esta análise com os vossos amigos ou grupos que seguem, ficarei vos muito grato.
ING- We can see a big picture triangle pattern and Head and Shoulder's reversal pattern that give us the down trend that take a sell side liquidity and make a new major low, so now we finished a major retest to the neck line of H&S pattern, in this case we can use Elliot impulsive wave 12345 that finished at fresh supply zone at resistance and neckline of H&S pattern, before drop of price we had a buy side liquidity taken so and then a big impulsive drop, in this case this will be a corrective Elliot Wave ABC. So now the price dropped to bullish order block, if the price respect OB we can see a corrective move in minor wave ABC that will be B wave of intermediary Elliot wave. We have a big probability that the price will take sell side liquidity before go up to resistance zone to finish B wave. At resistance zone we have minor equal highs that have liquidity to take and if we use inverted fibonacci, we can see 38% (golden zone) so we can expect some reversal pattern between 38&50% of inverted fibonacci. When price reach our red eye we can search for sell opportunities and when price reach our green eye we can look for buy opportunities. Don't rush there are many opportunities in the market, set price alerts and stay calm, wait for your chance to enter, and don't forget to follow a risk management plan that is appropriate to your capital. GOD bless you and have a good trading. If you could share this analysis with your friends or groups you follow I would be very grateful.
GOLD 4H
GOLD 1H
 Viés de baixa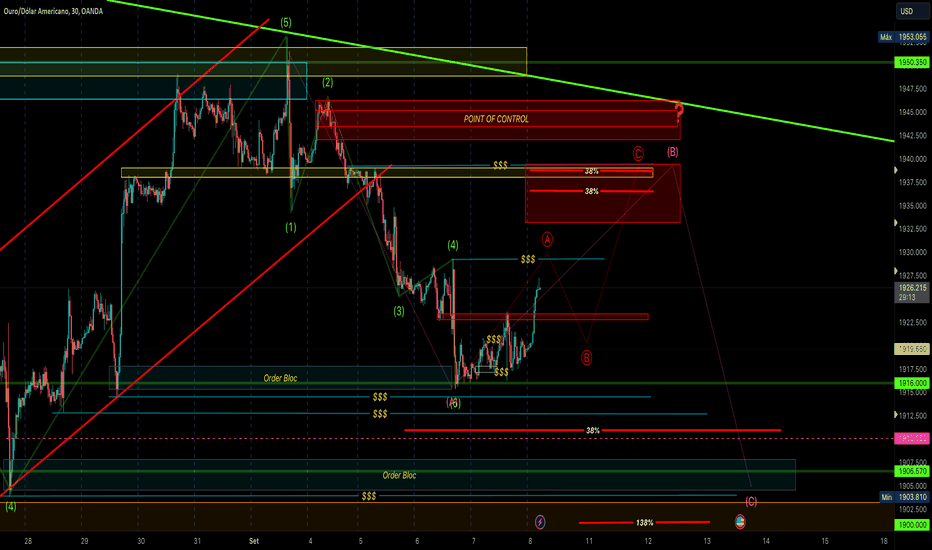
 Viés de alta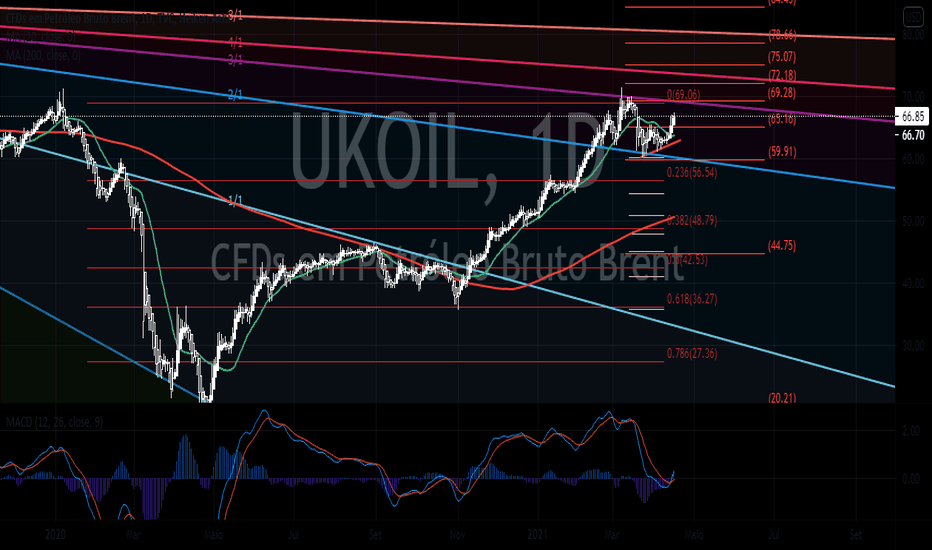
 Viés de baixa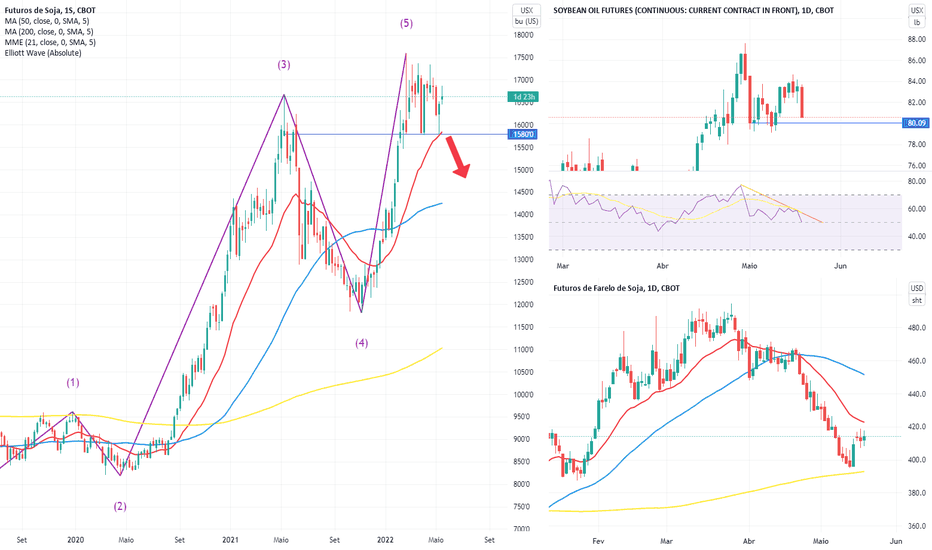
 Viés de alta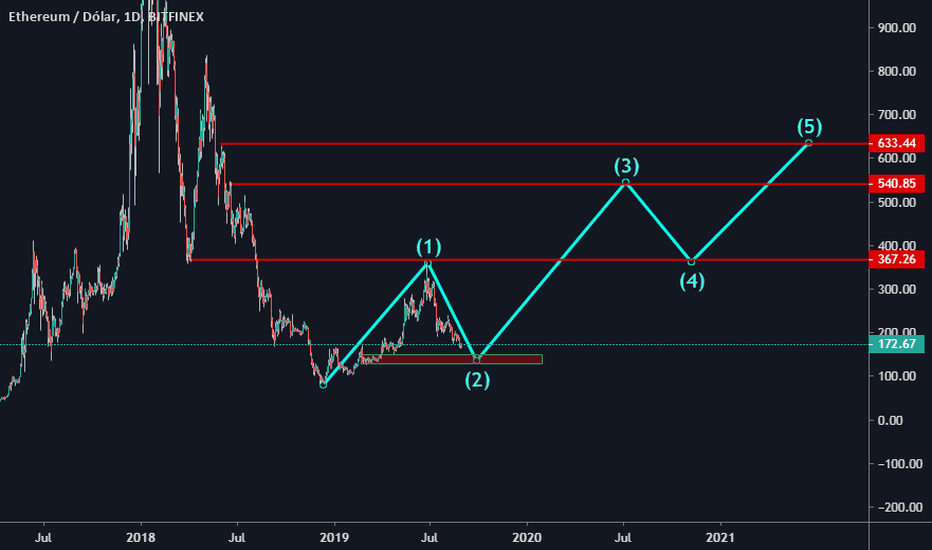
Viés de alta 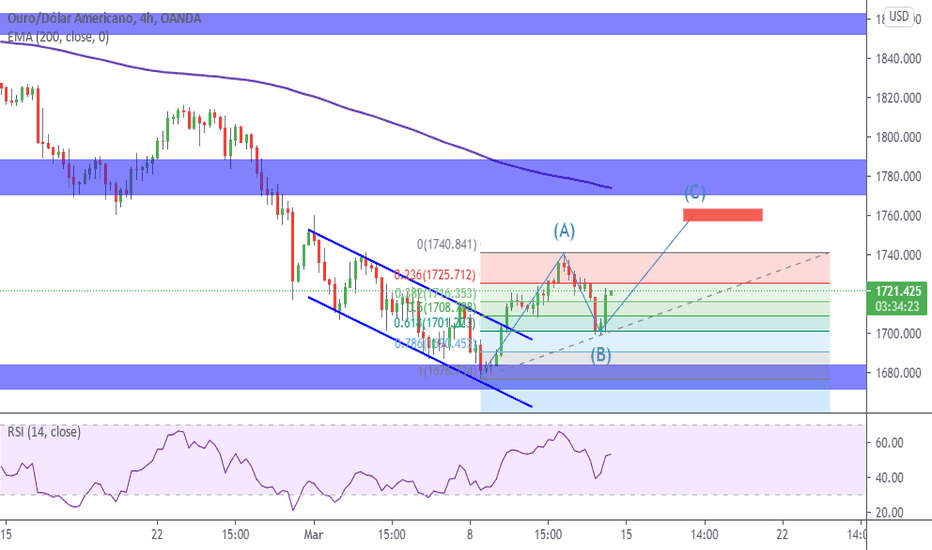
XMR permanece BULLISH, e os alvos são altosMonero concluiu a primeira onda de alta, iniciou a segunda e atualmente nos encontramos na onda impulso 3. Recentemente a Bitrex deslistou Monero em função das regulações do governo dos EUA. A queda resultante, no entanto, foi de apenas ~20%, em contraste com os ~70% de queda que ocorreu no Ripple (XRP).
Isso evidencia a diferença entre uma crypto com fundamentos fortes (XMR), que muitos especulam ter sido criada pelo próprio Satoshi Nakamoto, e uma moeda com fundamentos fracos como a Ripple.
Na contagem de Elliot Waves, a recente queda parece que será apenas uma correção B (segunda parte de 5) dentro de uma onda longa 3 (lembrem que nas contagens de Elliot, Ondas 3 devem ser mais longas que as Ondas 1. Se esse for o caso, é uma excelente oportunidade de compra pois devemos ver XMR a 1000 USD em 2021.  Viés de alta
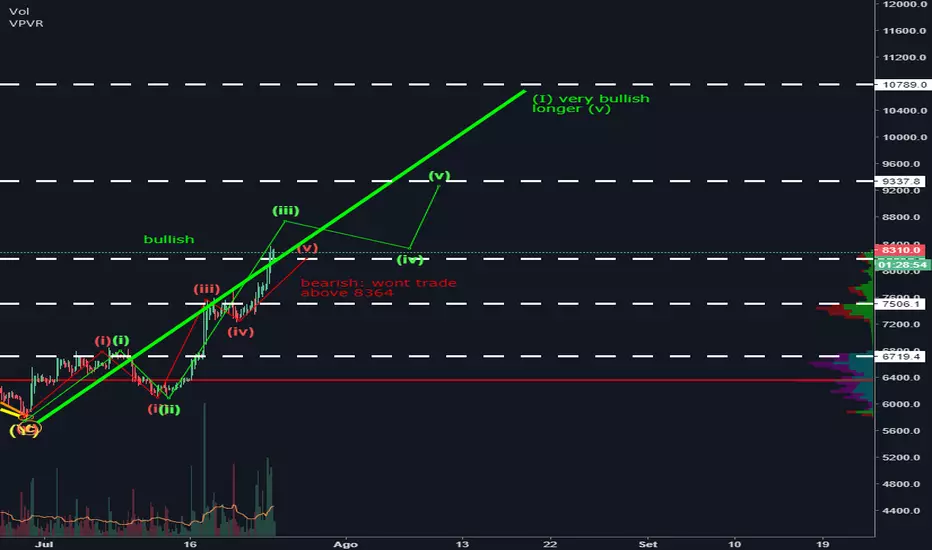
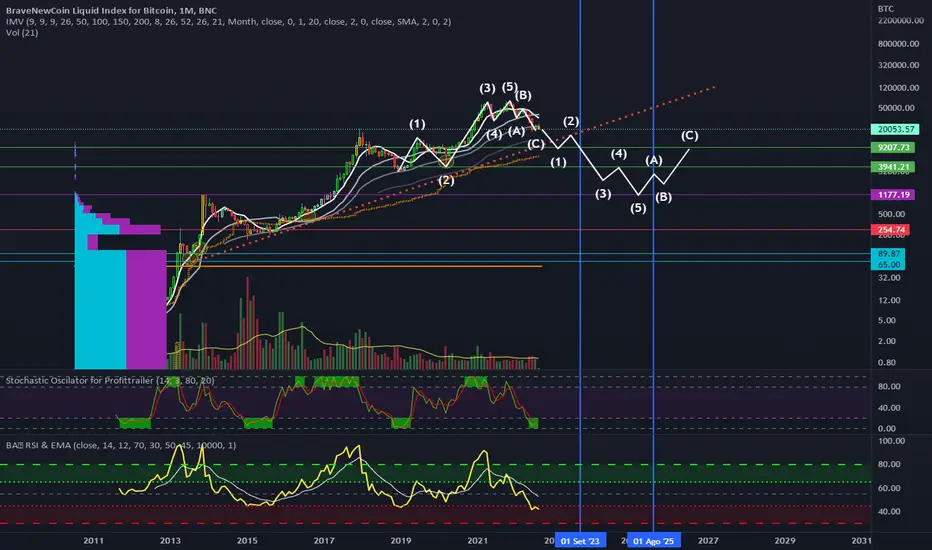
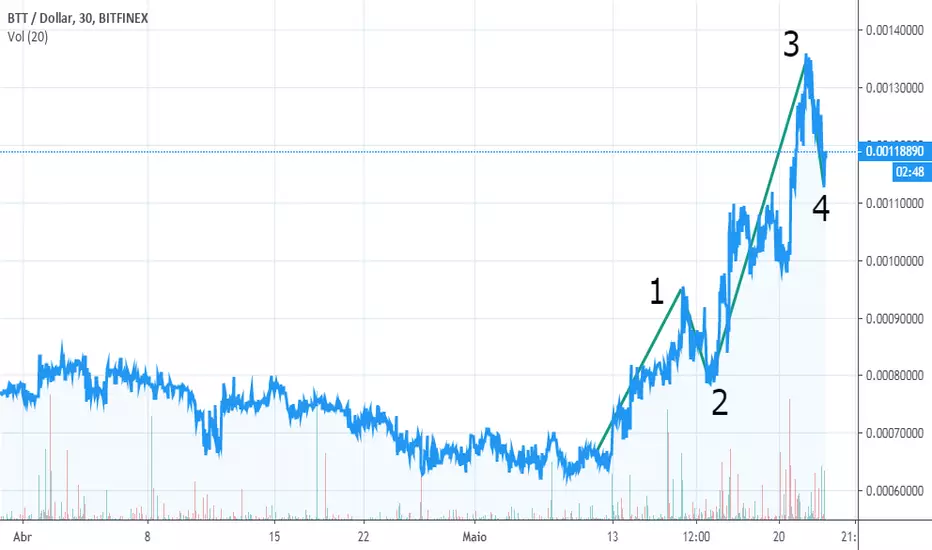
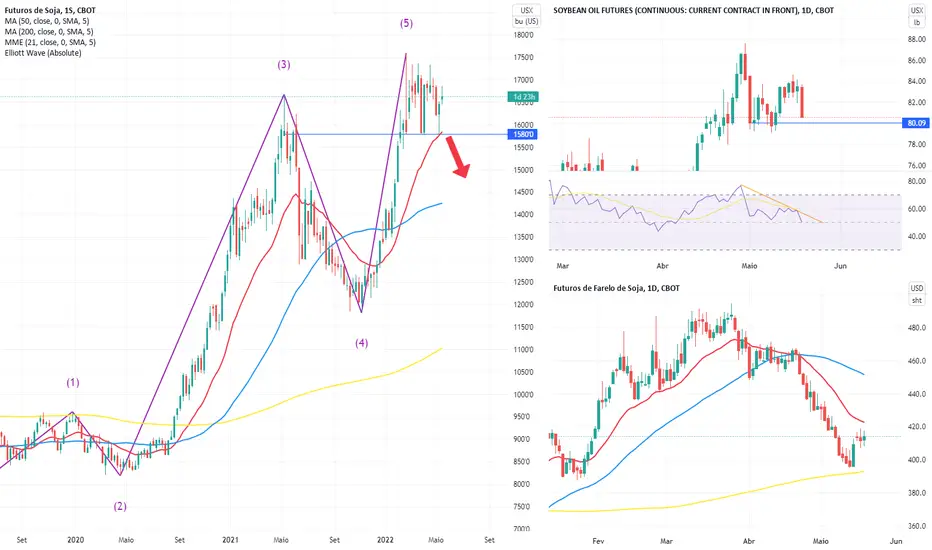
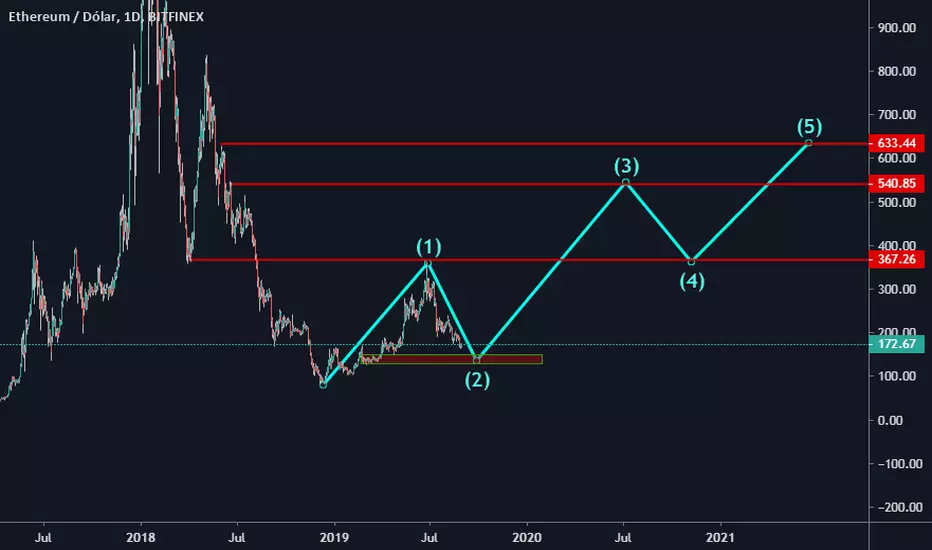
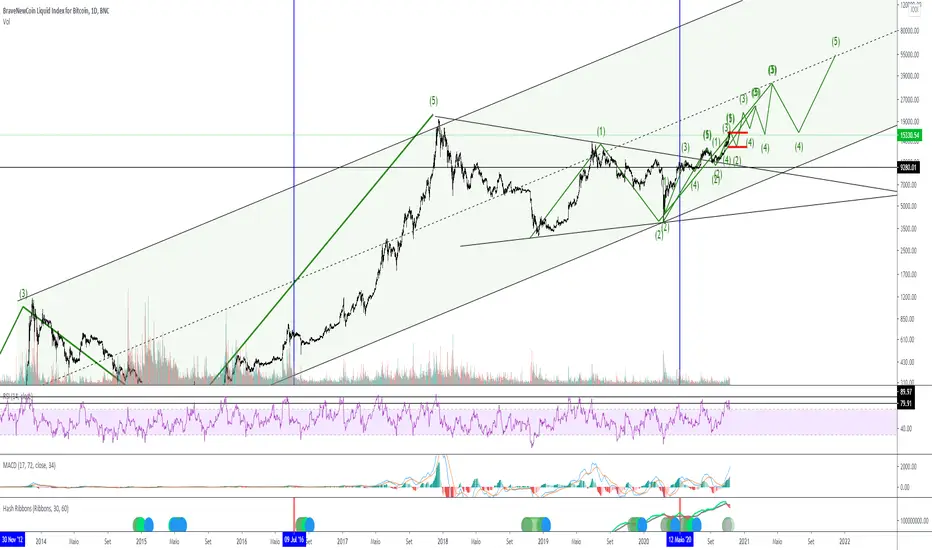
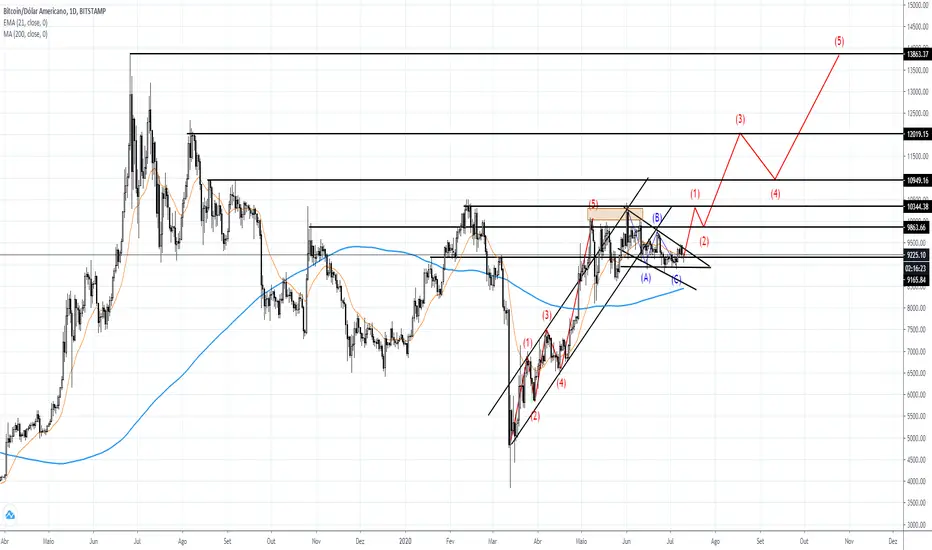
BTC -- Elliot WavesO que são ondas de Elliott?
As ondas de Elliott são uma técnica de análise criada na década de 1930 pelo contador americano Ralph Nelson Elliott. Após observação de décadas de dados de ações no mercado financeiro, ele concluiu que os preços dos papéis seguem padrões gráficos. Esses padrões geométricos das ondas seriam gerados pelo sentimento da massa do mercado.
Os princípios da teoria de Elliott incluem:
Emoção antes da ação: Esta é a primícia da teoria e especifica que os registros gráficos apresentados são as variações do humor da massa (compradores/vendedores). Ou seja, o volume maior precificará o ativo. Isso está presentado, por exemplo, nas tendências de alta e tendências de baixa.
Atitude manada: É quando os investidores seguem o fluxo, perante a incerteza e ignorância da condições do mercado.
Segundo a teoria, o caráter psicológico das movimentações é reflexo de atitudes motivadas por:
1-Emoções
2-Impulsão
3-Subjetividade
Portanto, as oscilações dos preços dos ativos refletem a psicologia humana. Por causa desse fator e por ser baseada na catalogação de padrões gráficos, as ondas de Elliott explicariam, em tese, a evolução do preço de qualquer ativo. Viés de alta 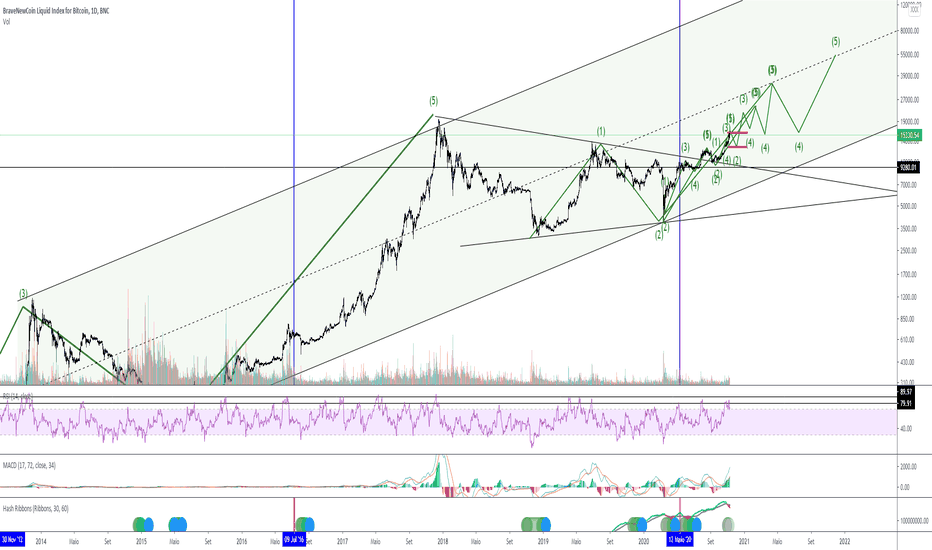
Viés de alta 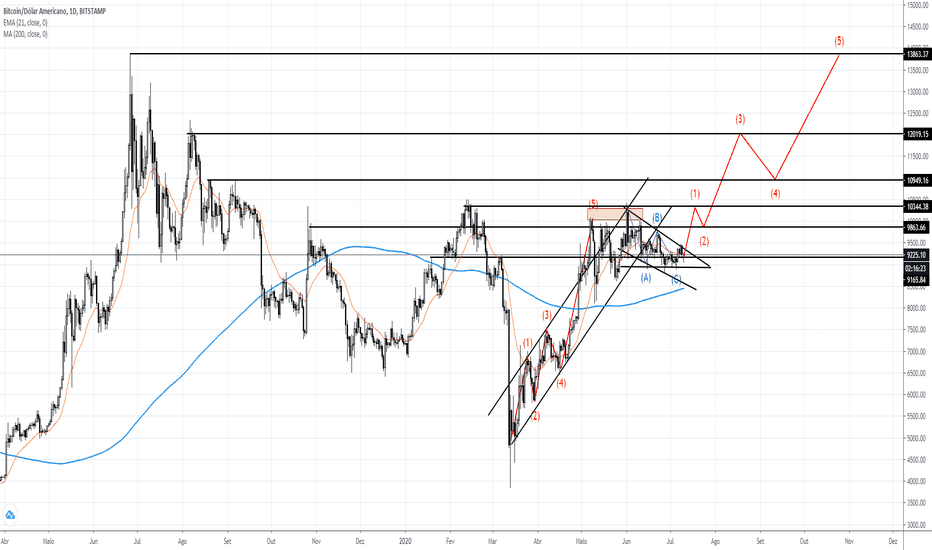

 Viés de alta